TABLE OF CONTENTS
STEP 1 - Login Page
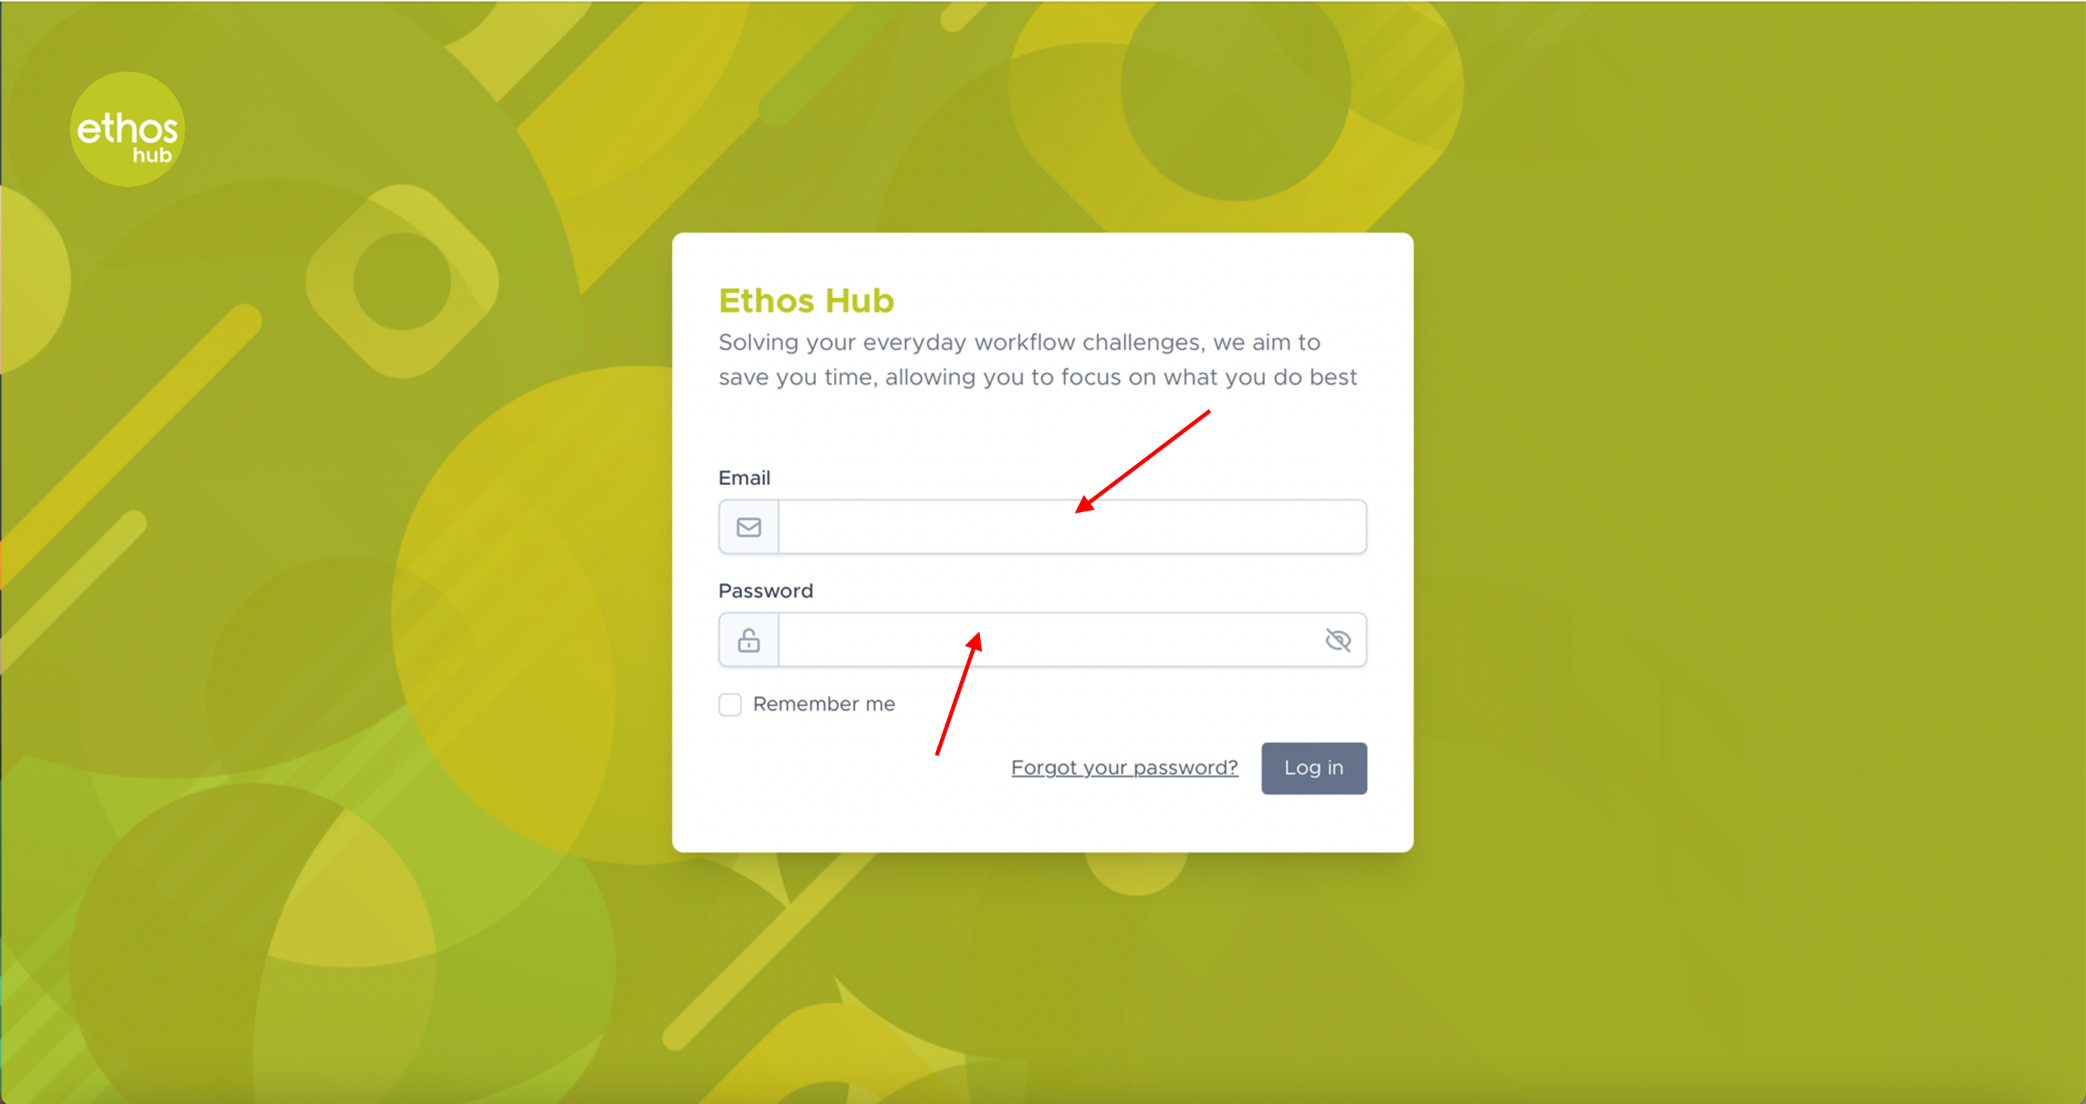 Enter your login email and password.
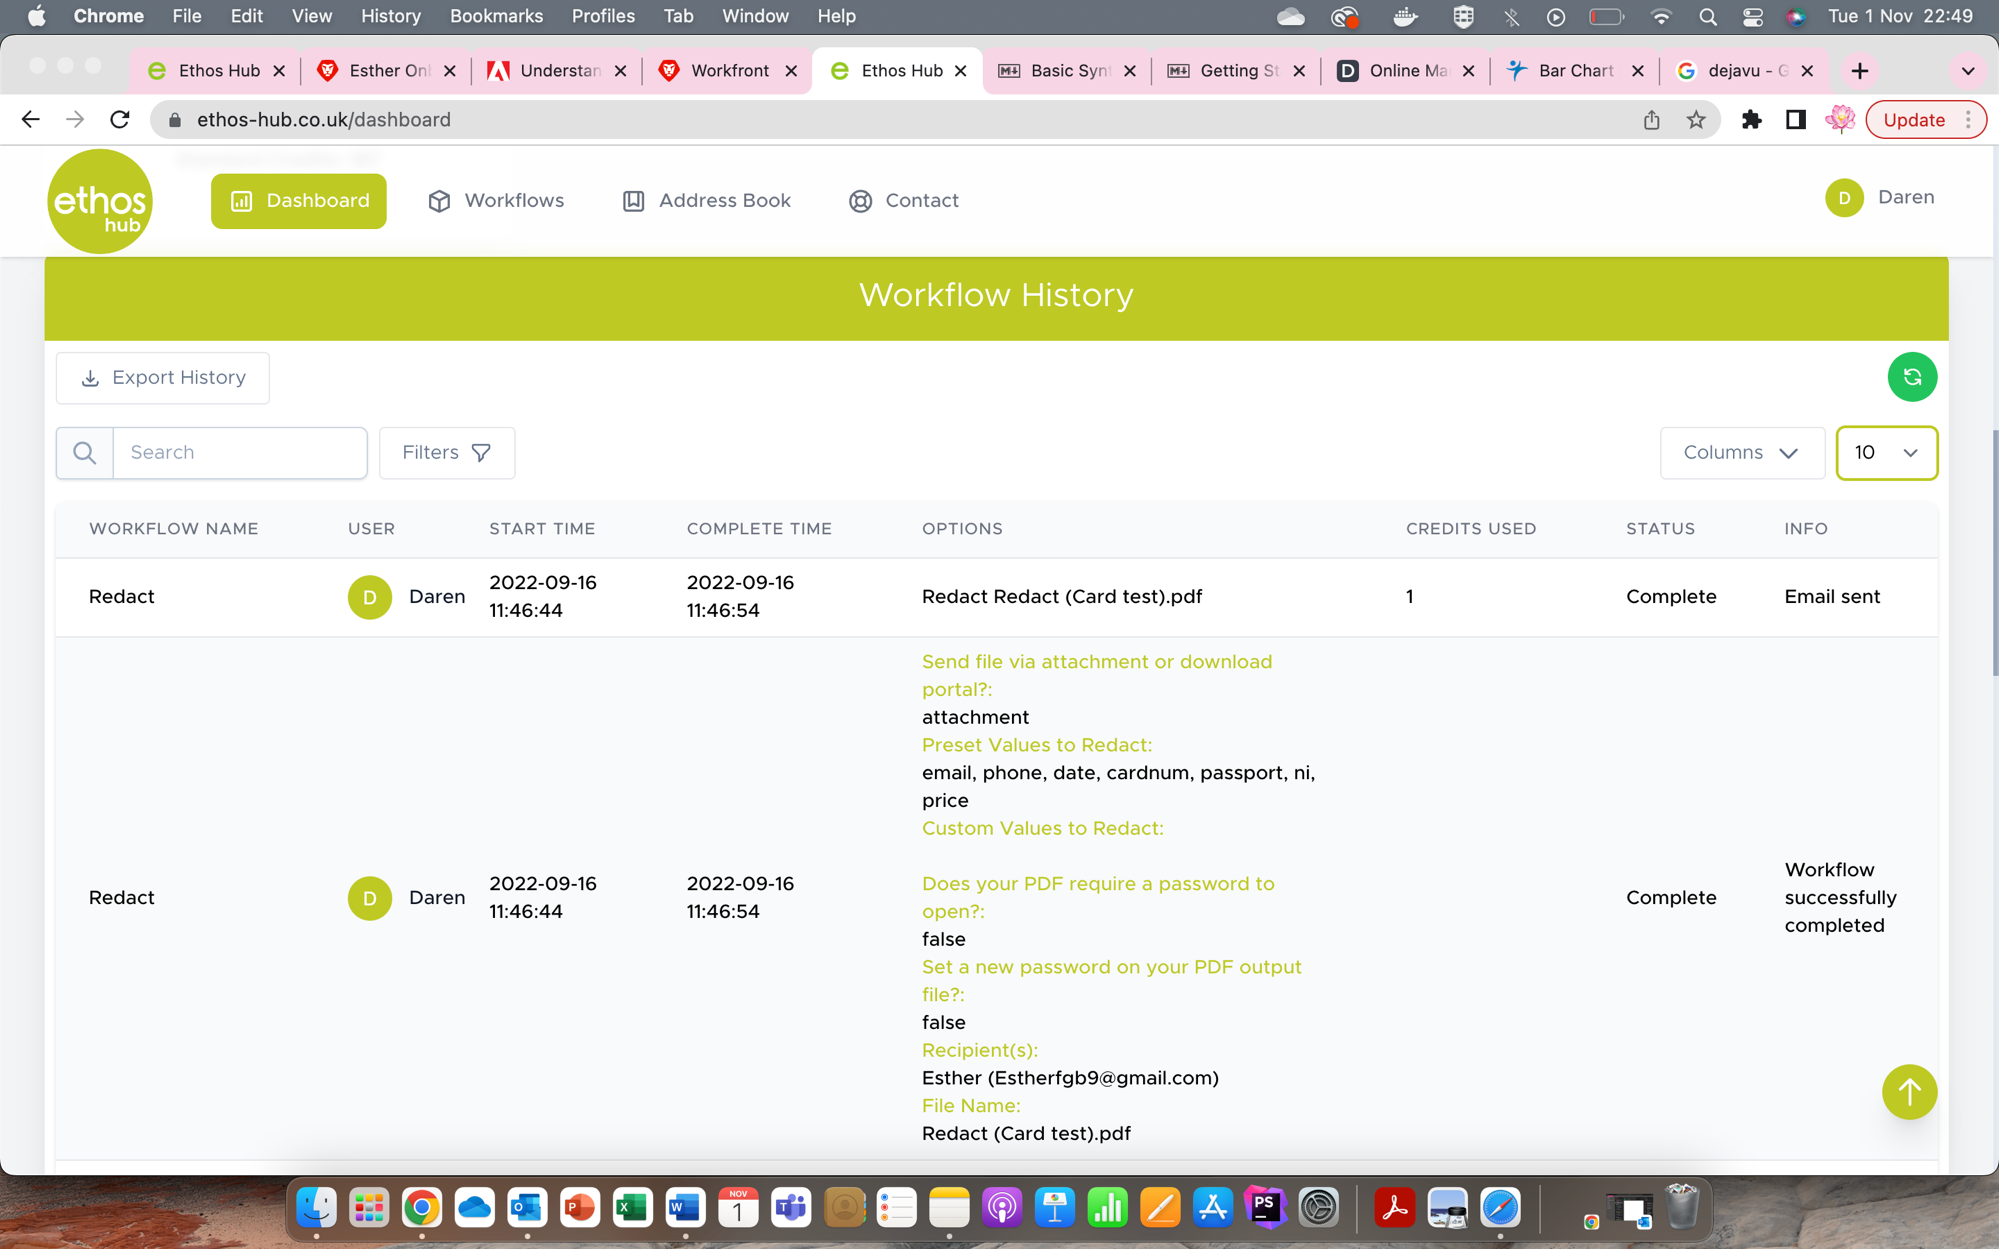
STEP 2 - Dashboard
Once you are logged in, please select the dashboard icon in the left-hand of the top taskbar as shown below.

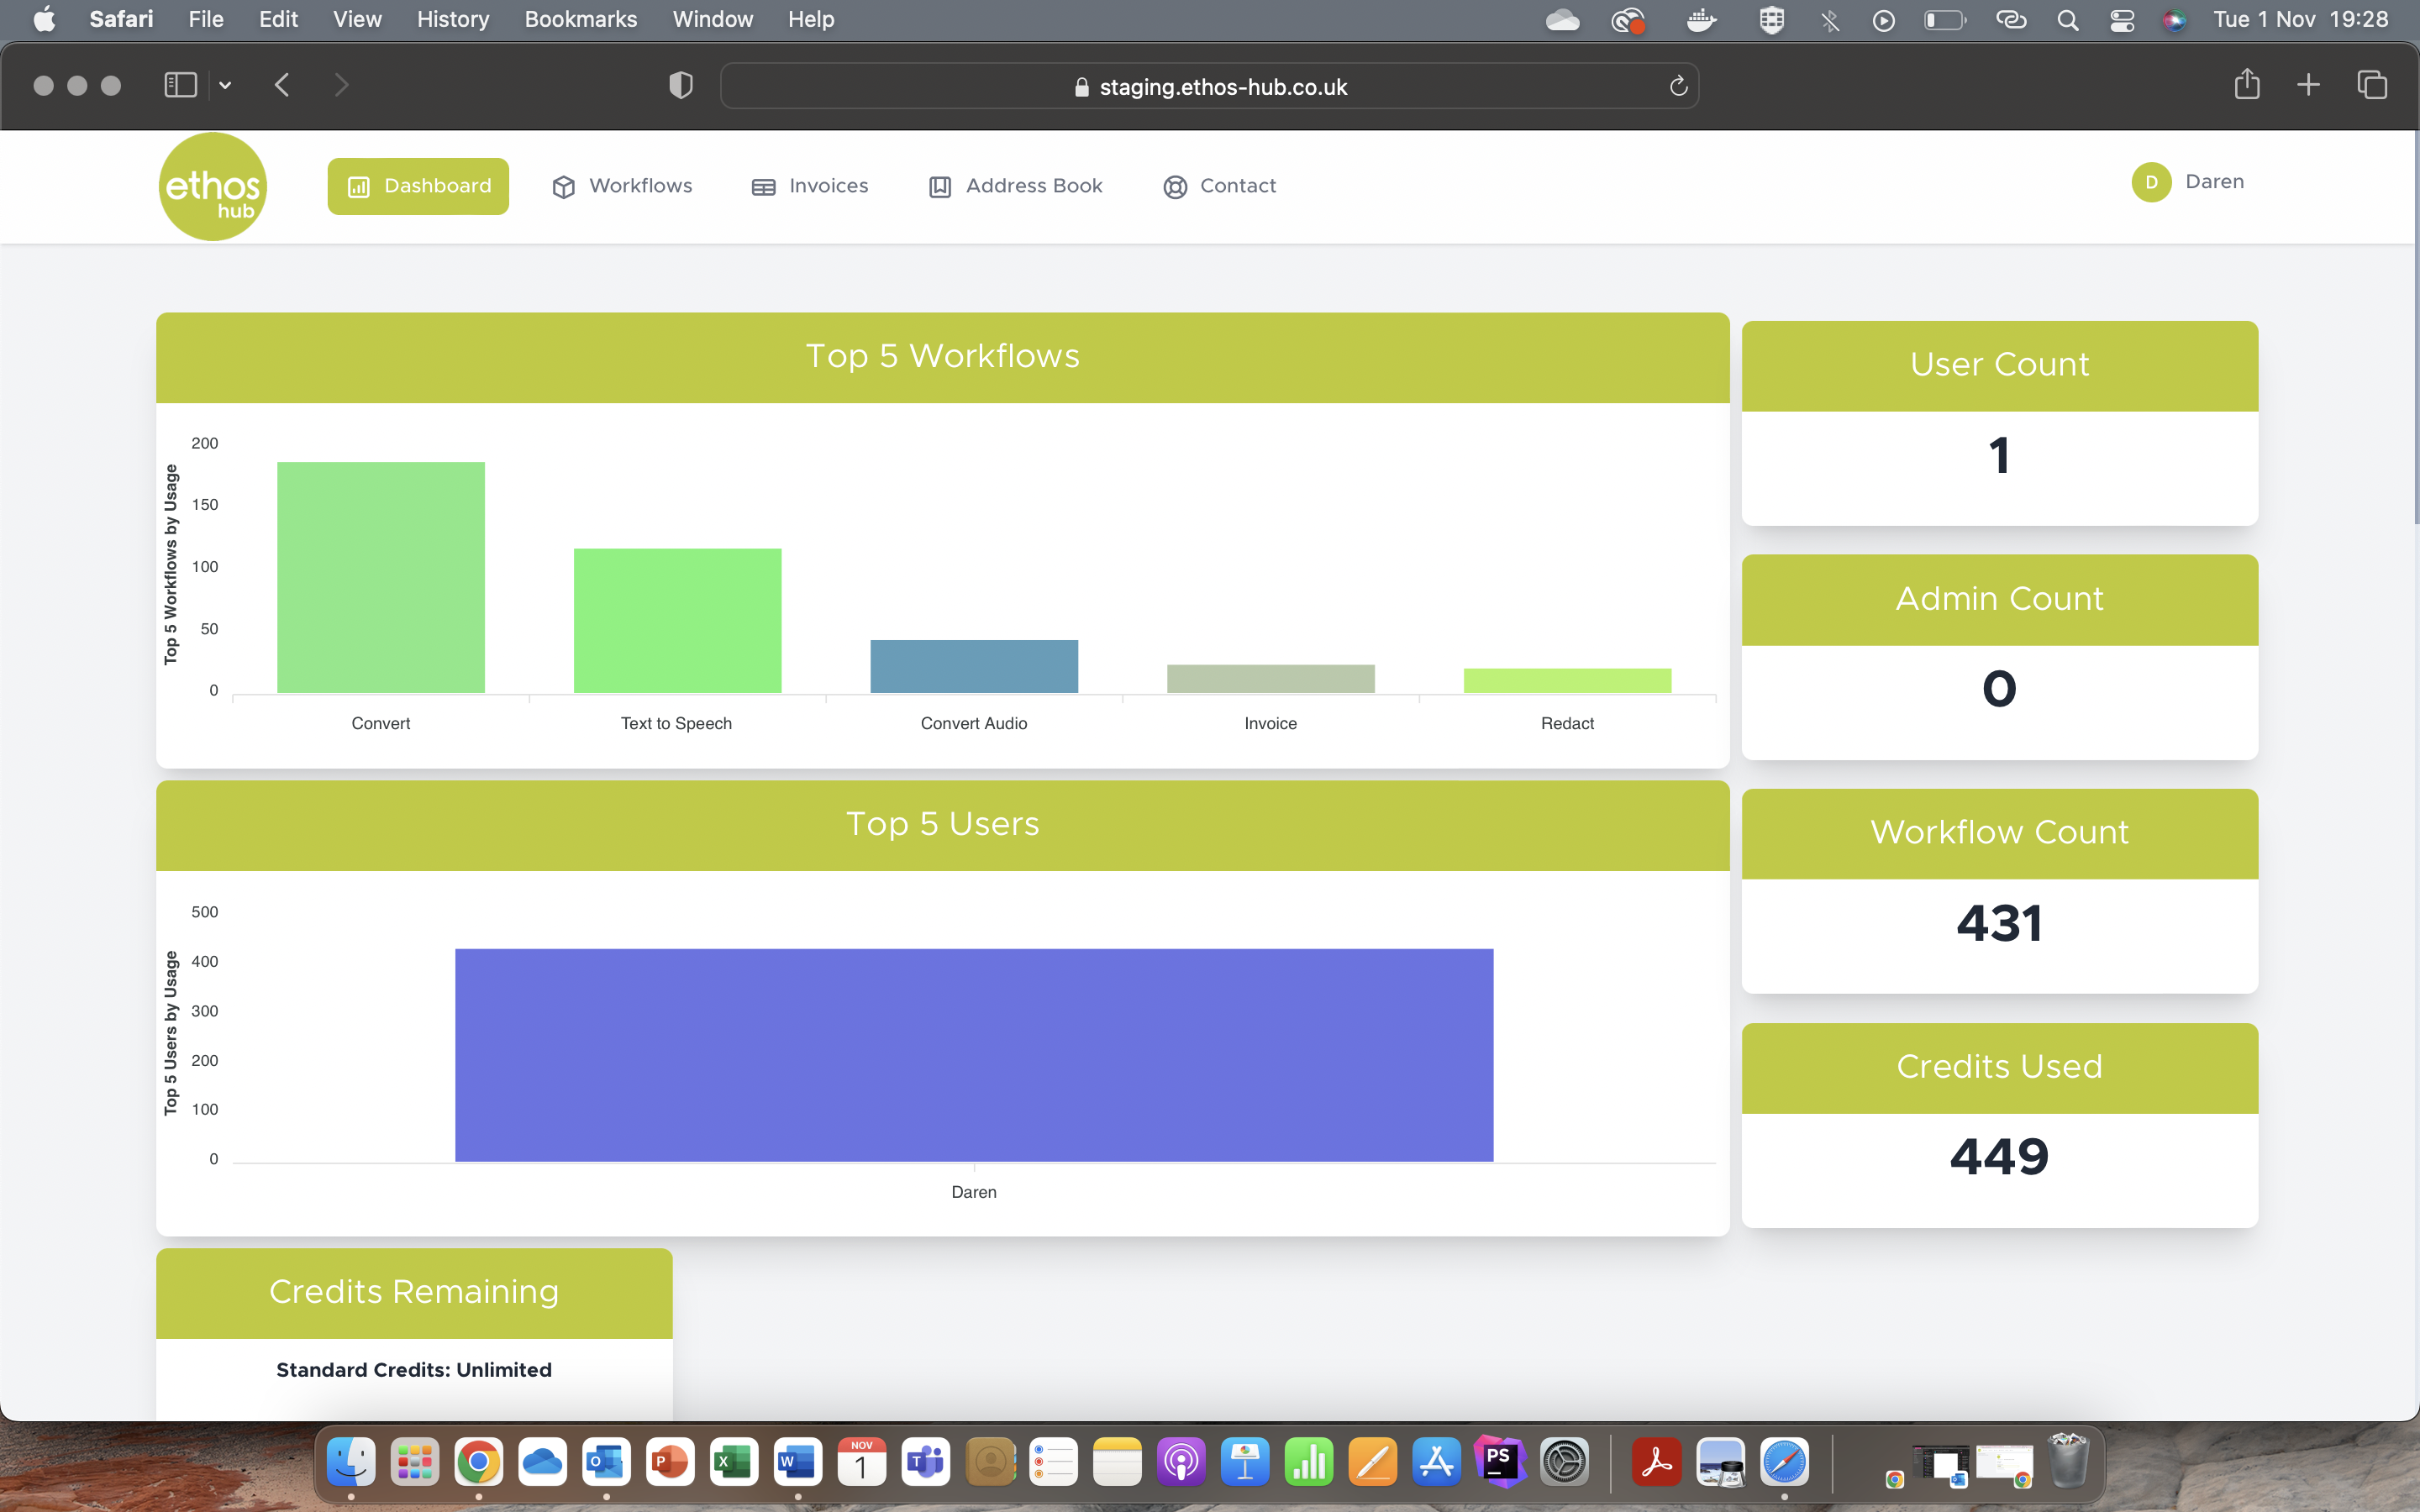
You will now be presented with the following page: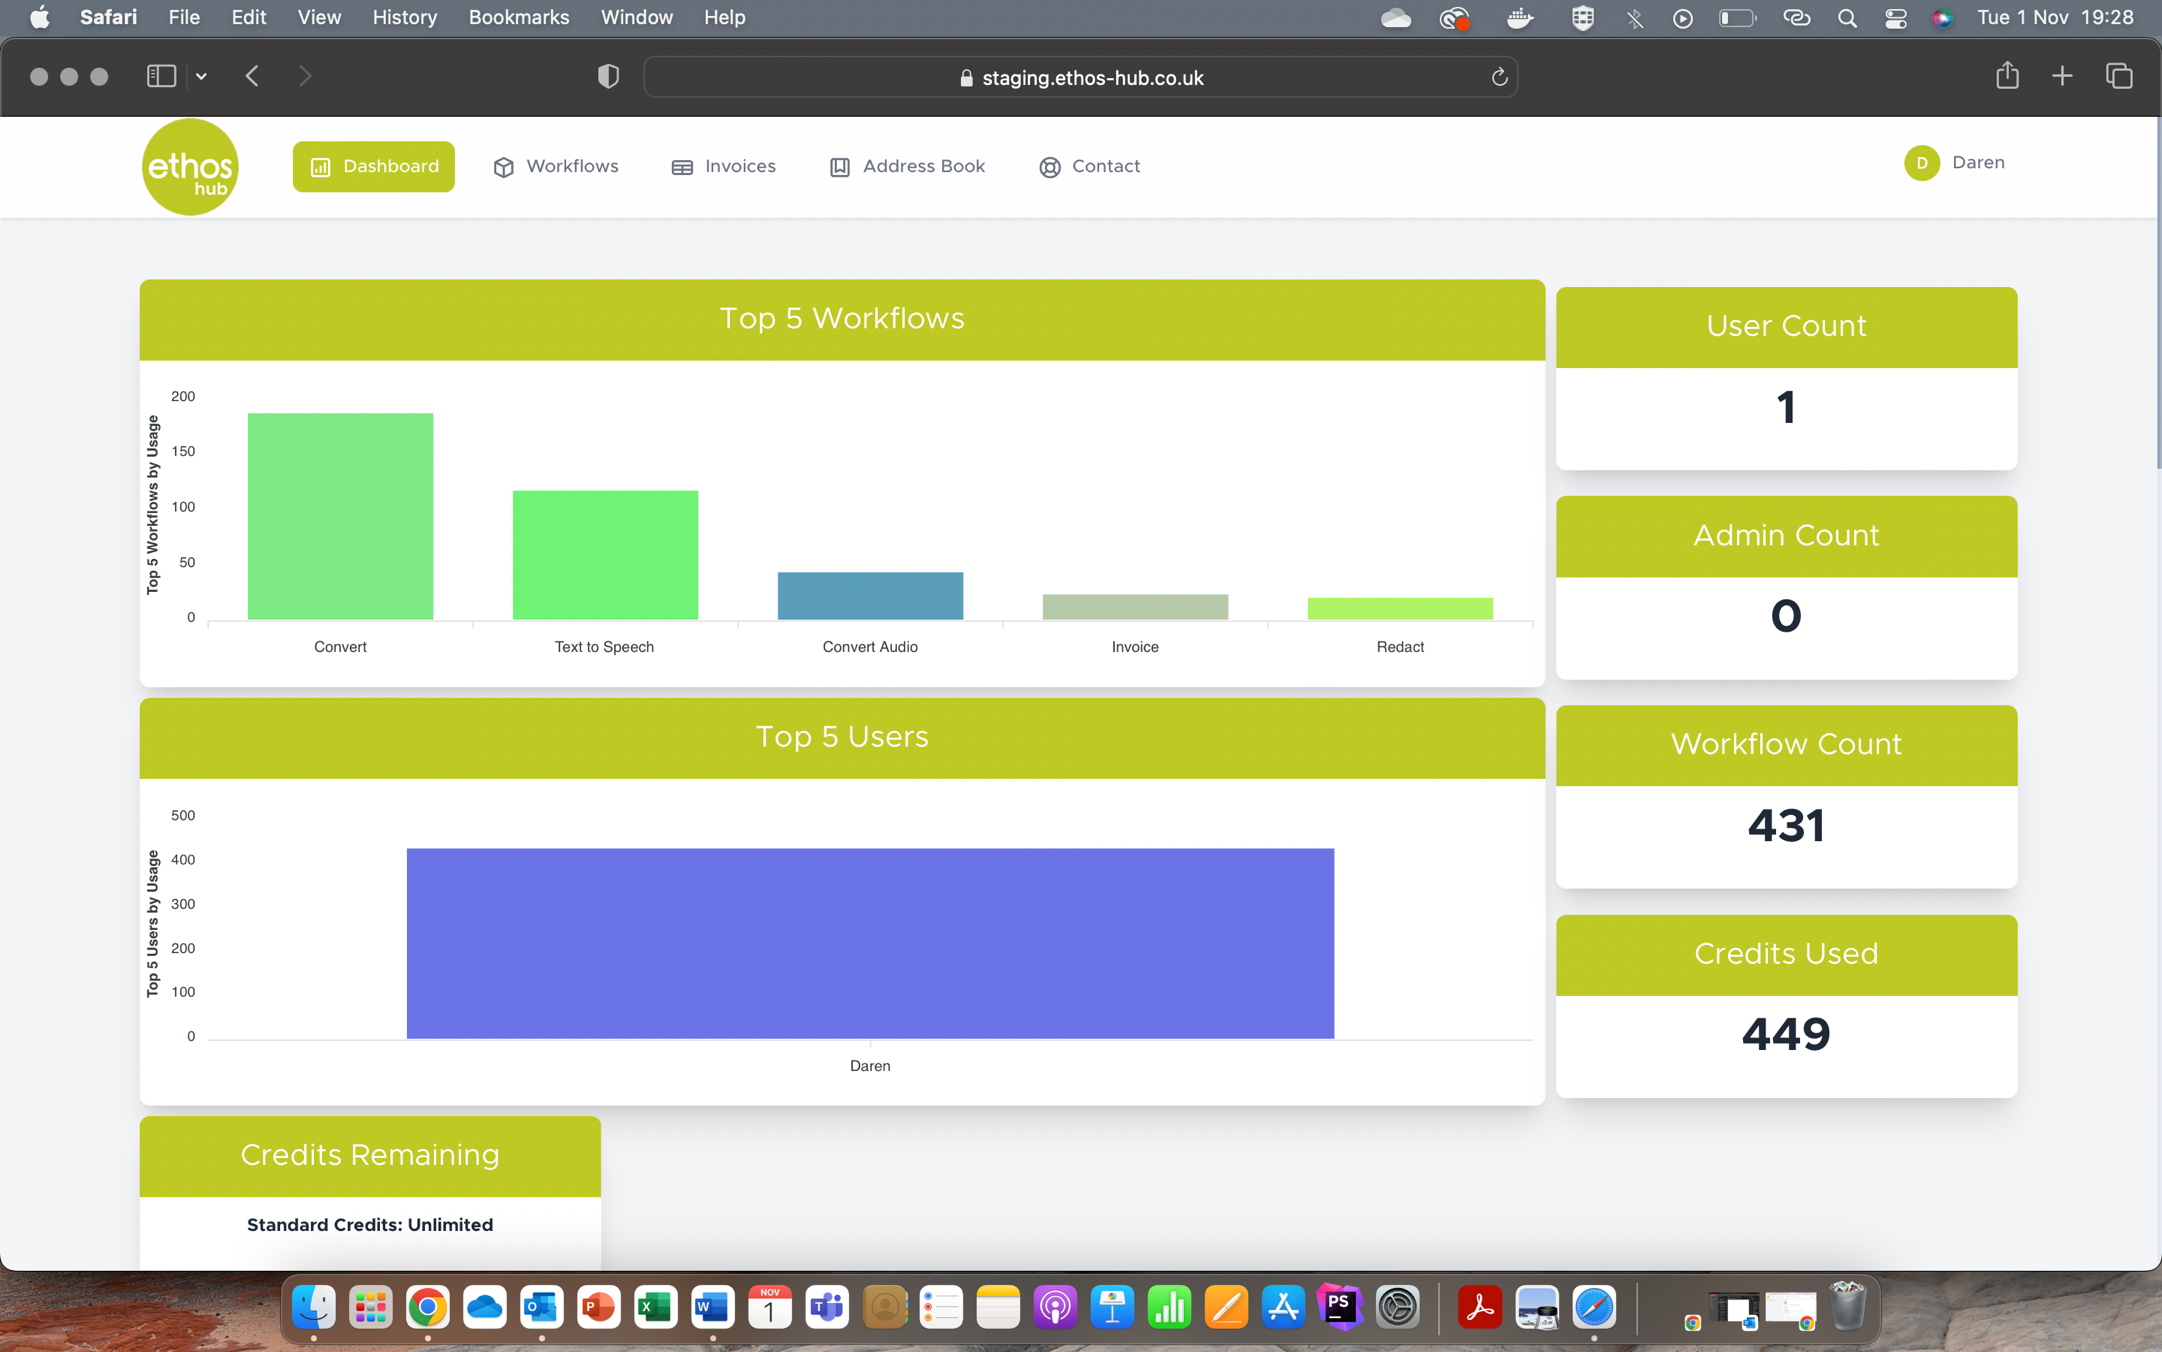
Note: Your dashboard will be personalised according to your company needs, please see the stages that follow for more detail.
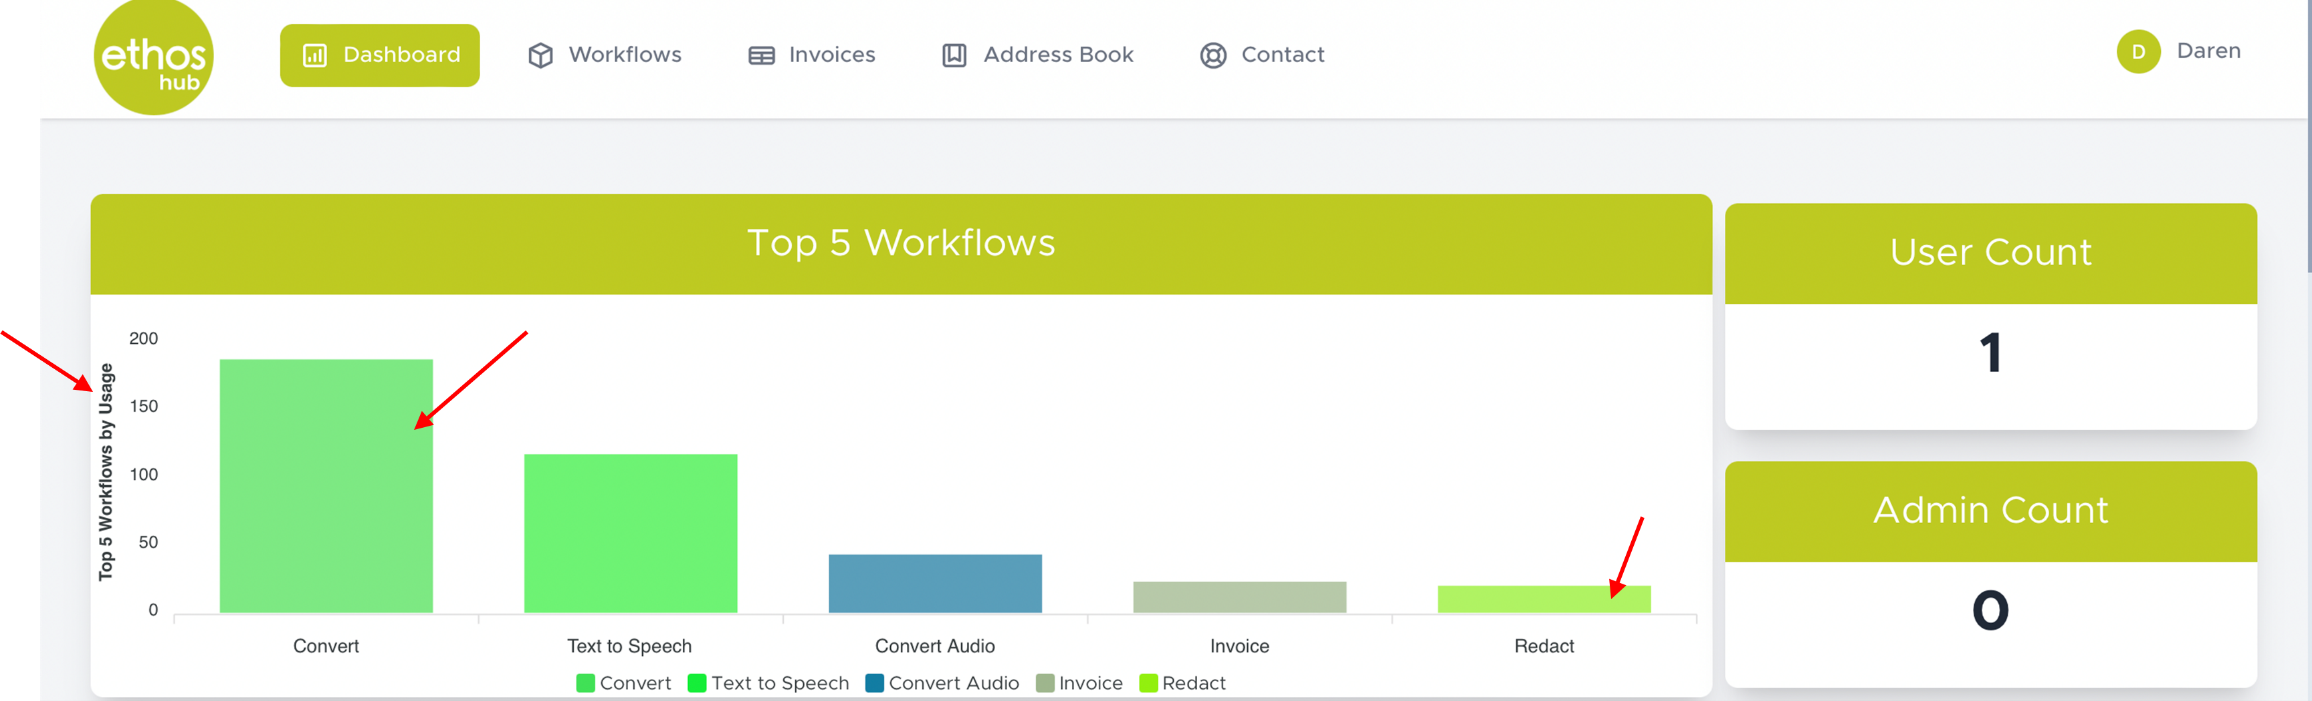
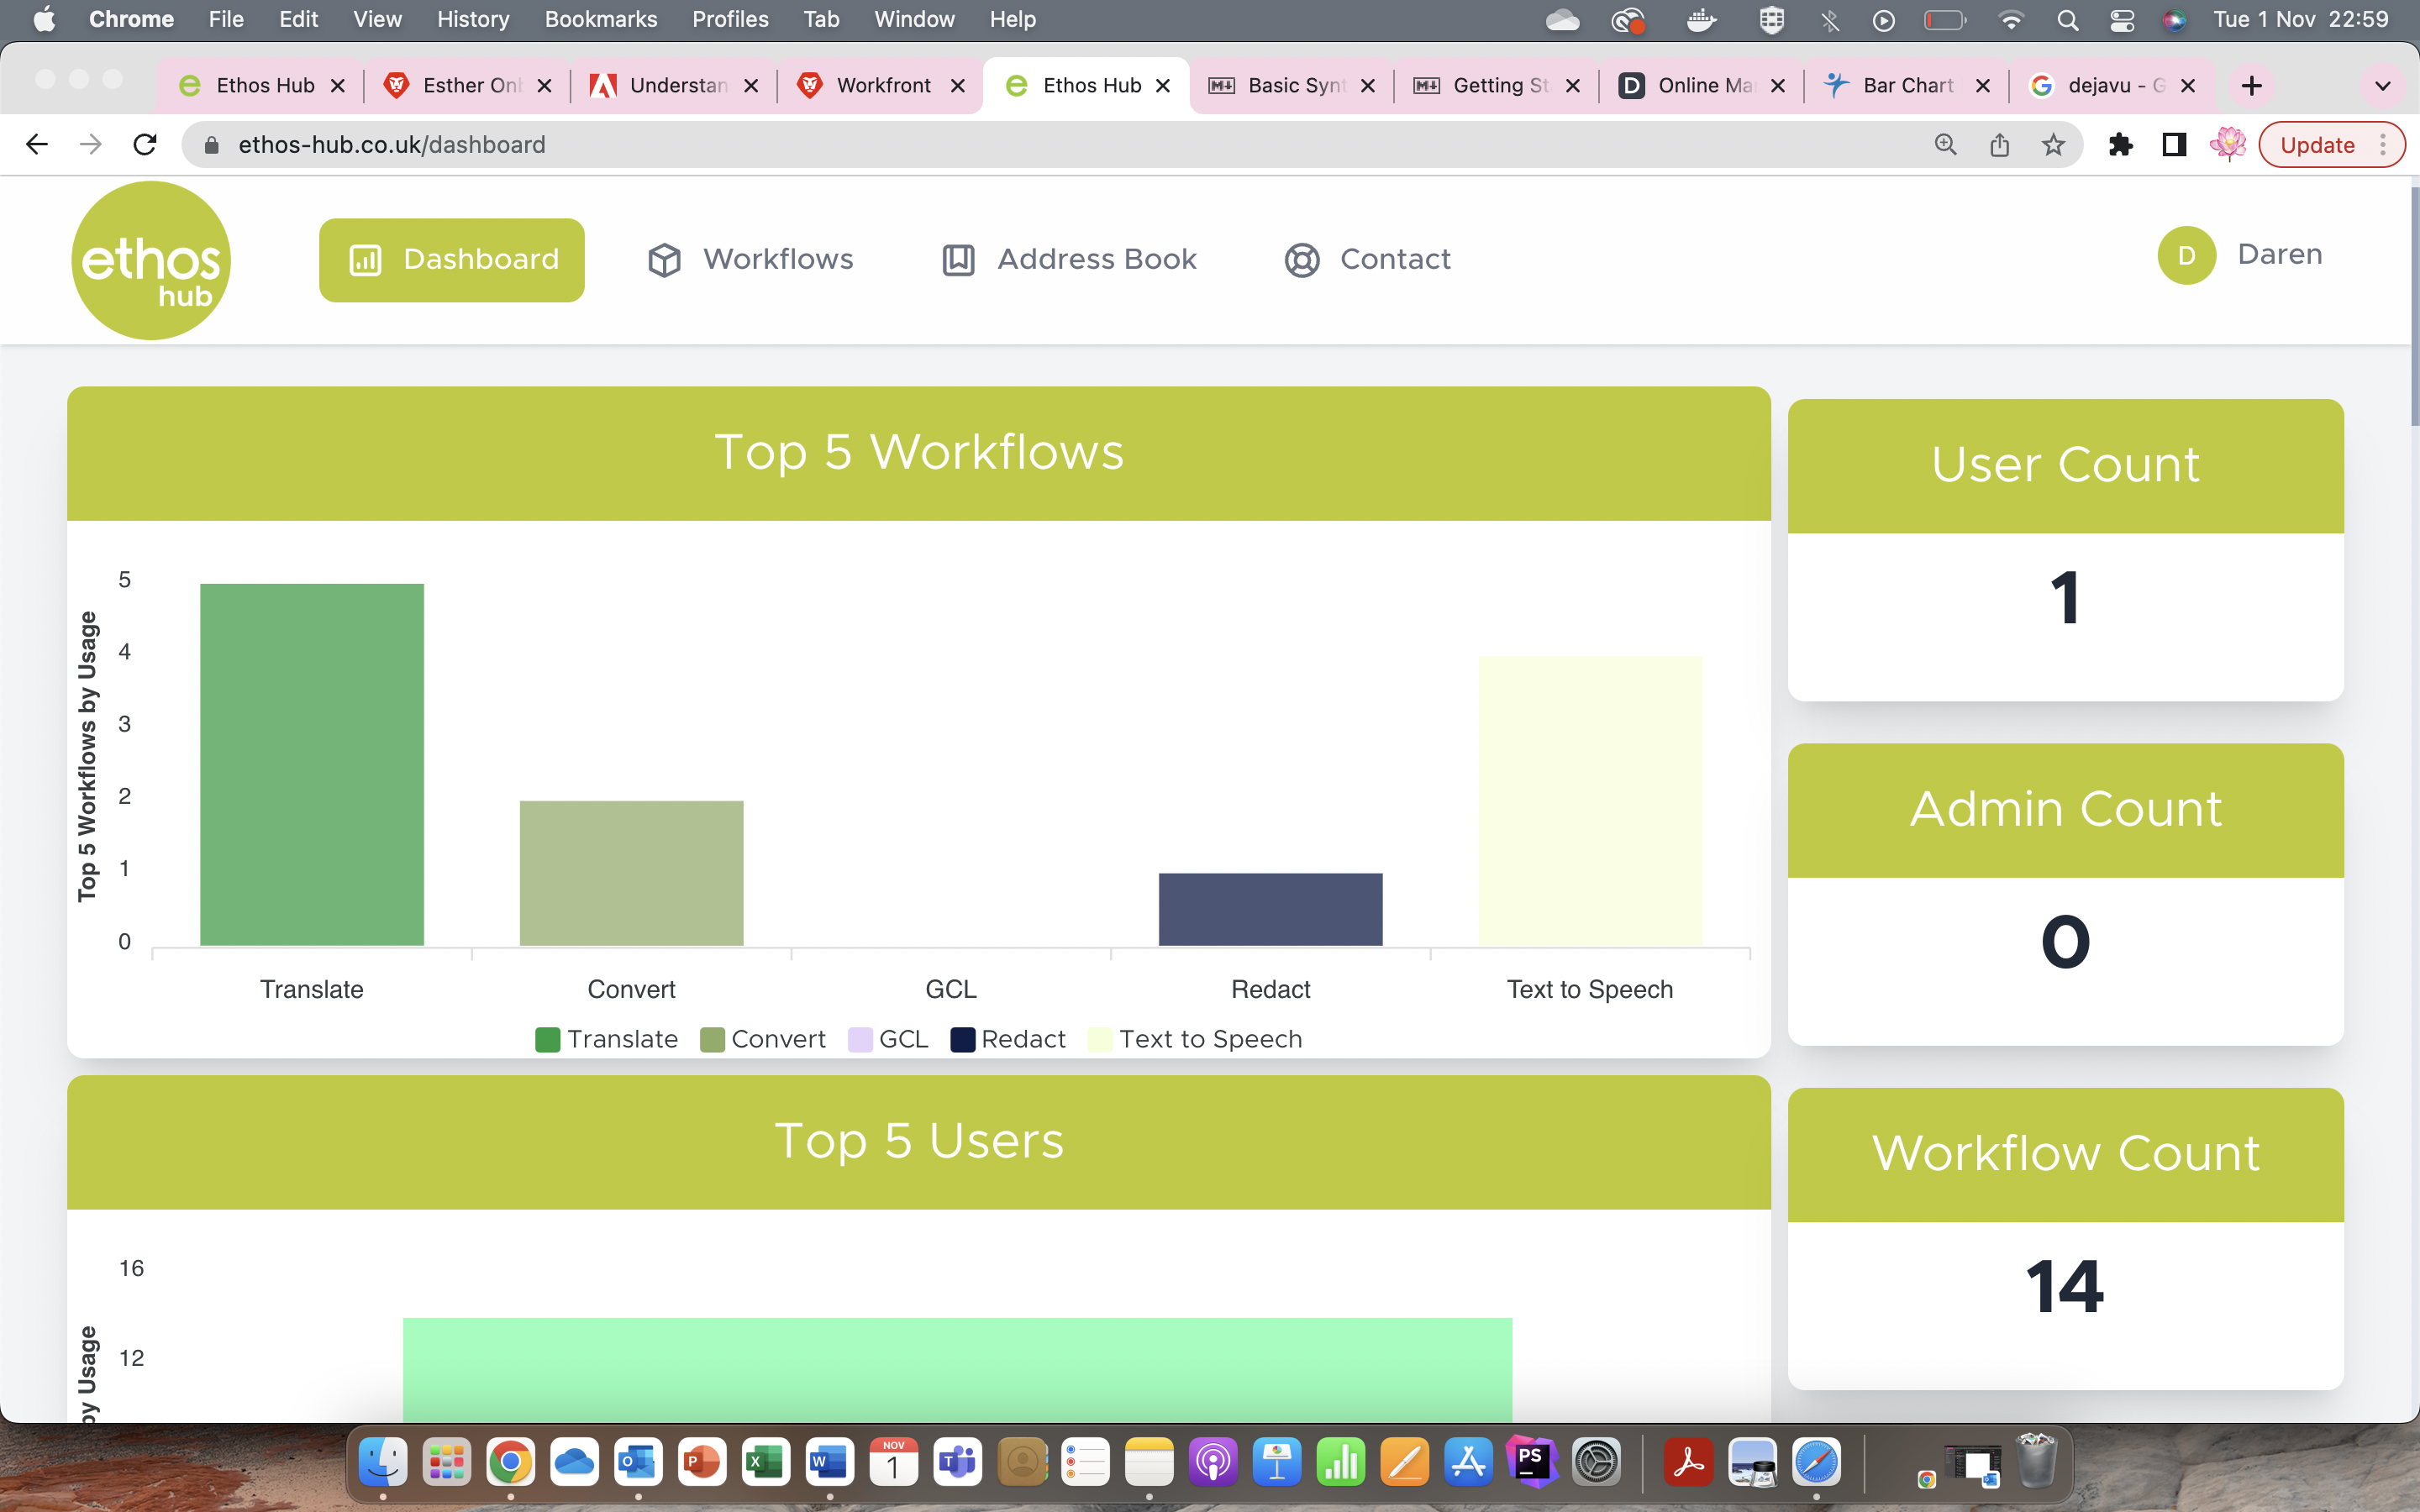
Top 5 Workflows
This section contains information regarding your company’s Top 5 Workflows by Usage. The Bar Chart shows the total usage for each of the workflows that are available to your company. The screenshot that follows shows that the most frequently used workflow is the convert workflow; the redact workflow on the other hand is used the least.
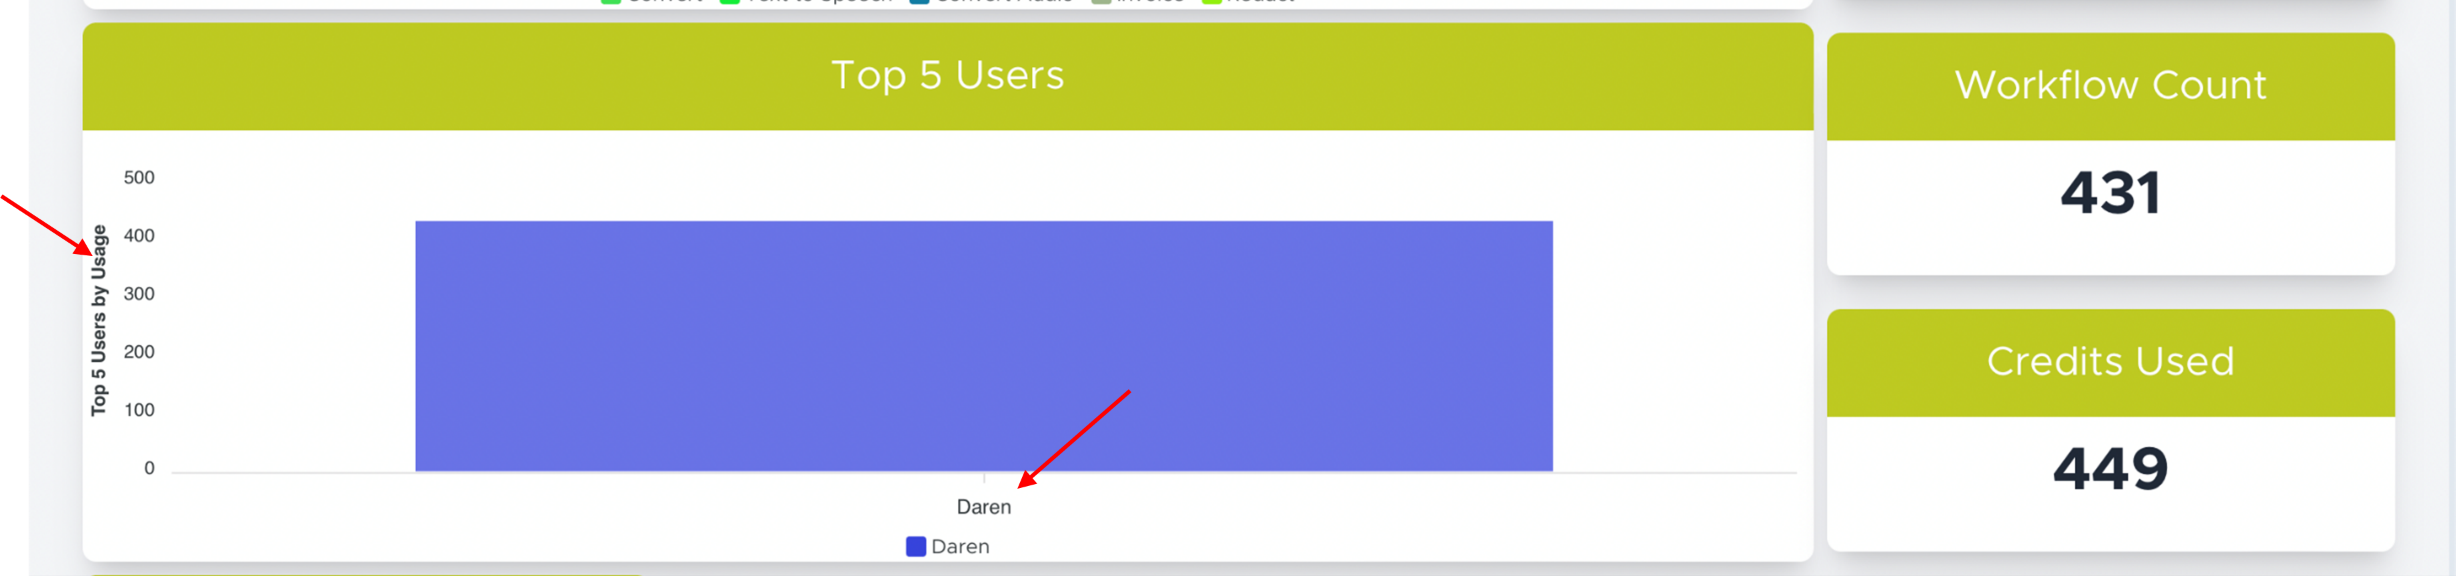
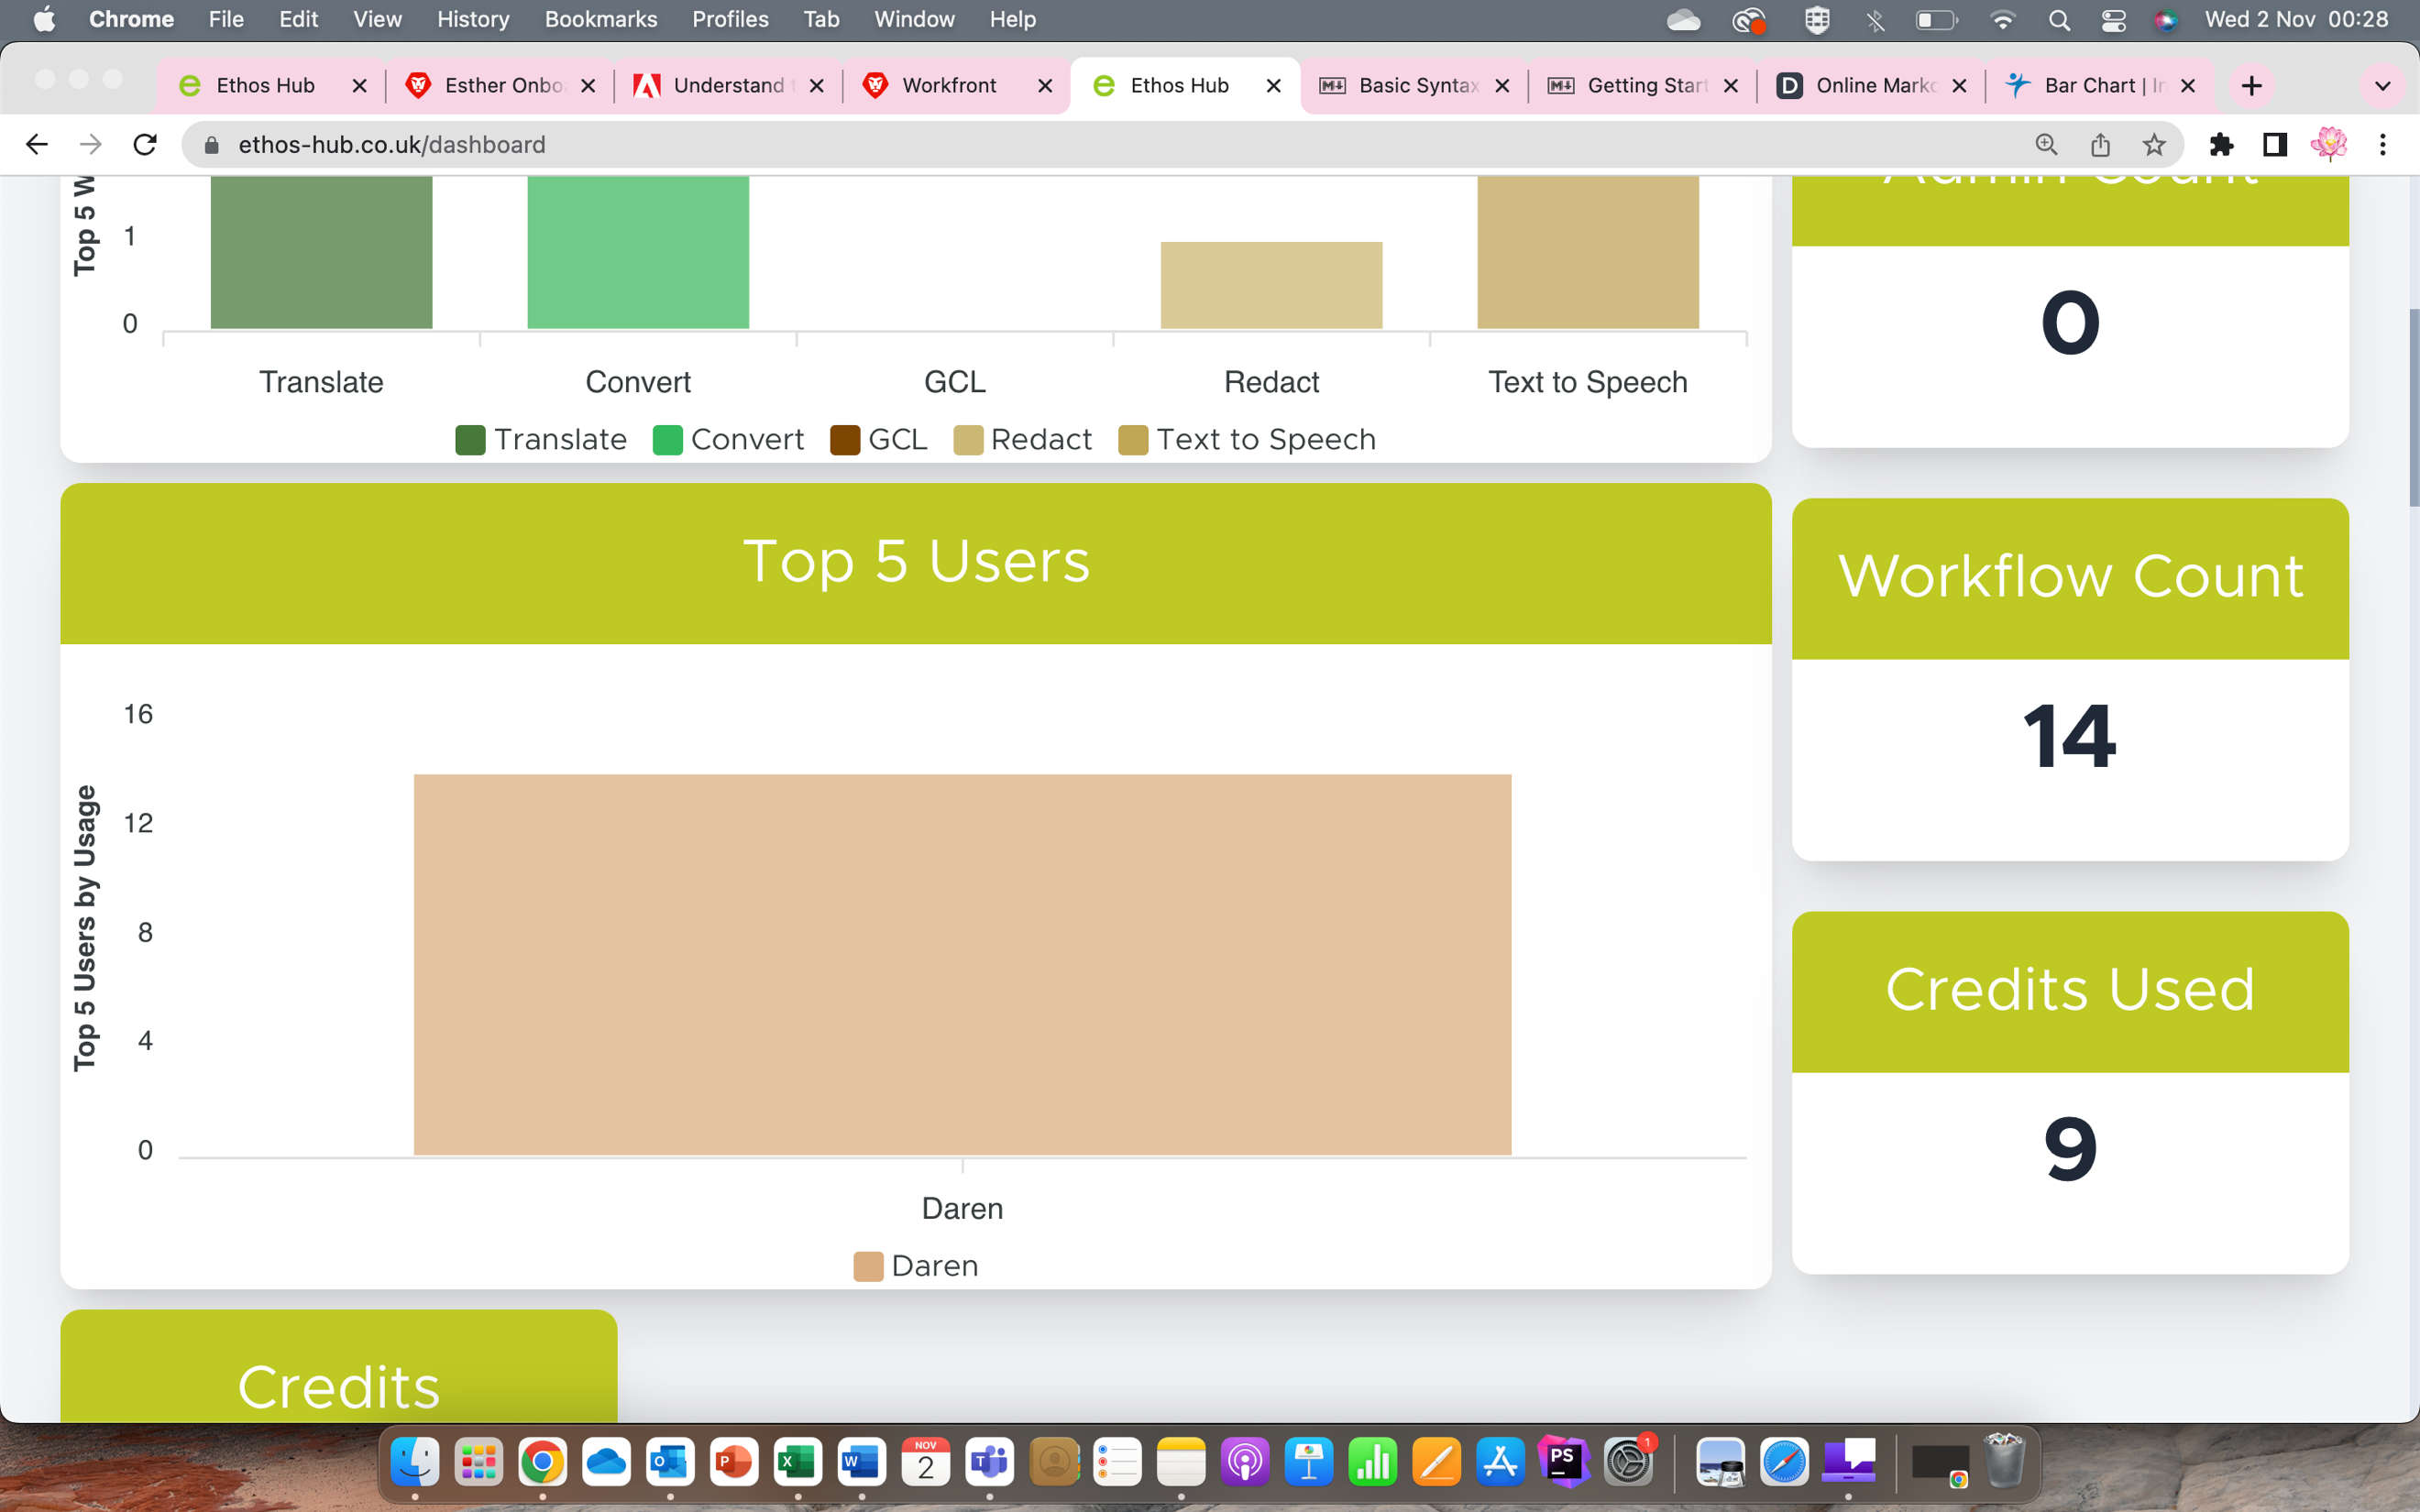
Top 5 users
This section contains information regarding your companies Top Users by Usage. The Bar Chart shows the total usage of the users that are available in your company. The screenshot that follows shows that the top user in this case is Daren as he is the only user assigned to his company.
Workflow History
This section contains information regarding your workflow history. Here you can see an overview of the workflows you have used. This will be detailed further in the next step.
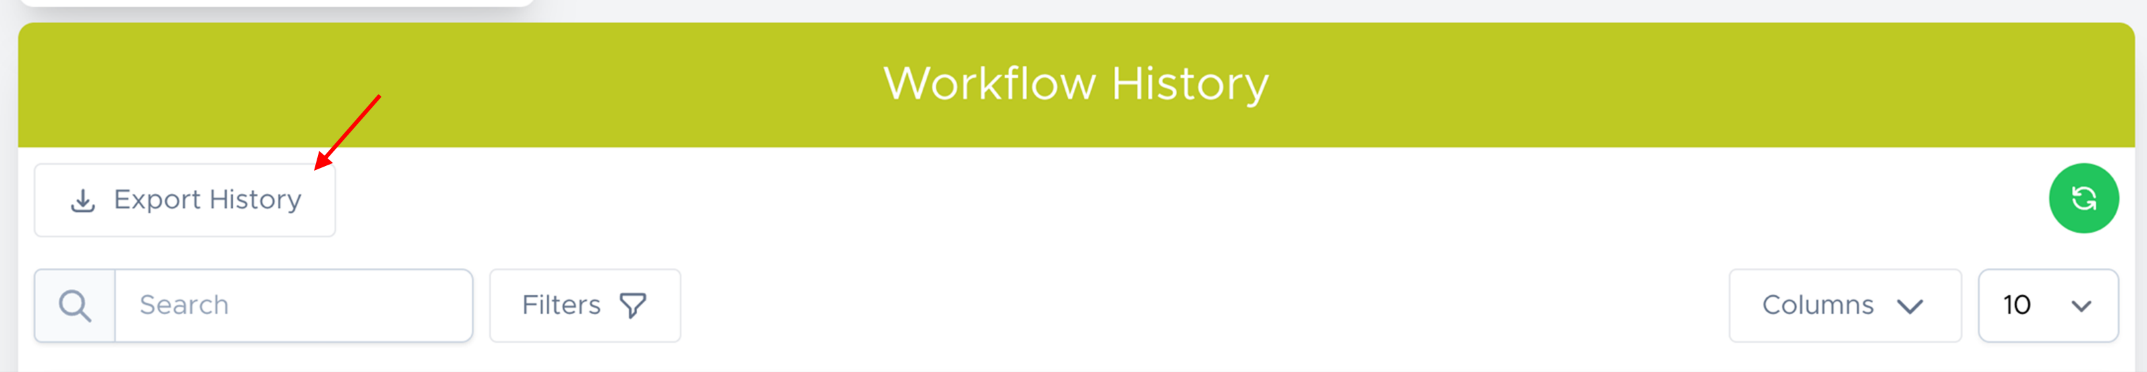
Export History
In your workflow history you have different options to enhance your experience. If you click on the export history button this will export the information regarding your existing workflow history into an Excel spreadsheet.
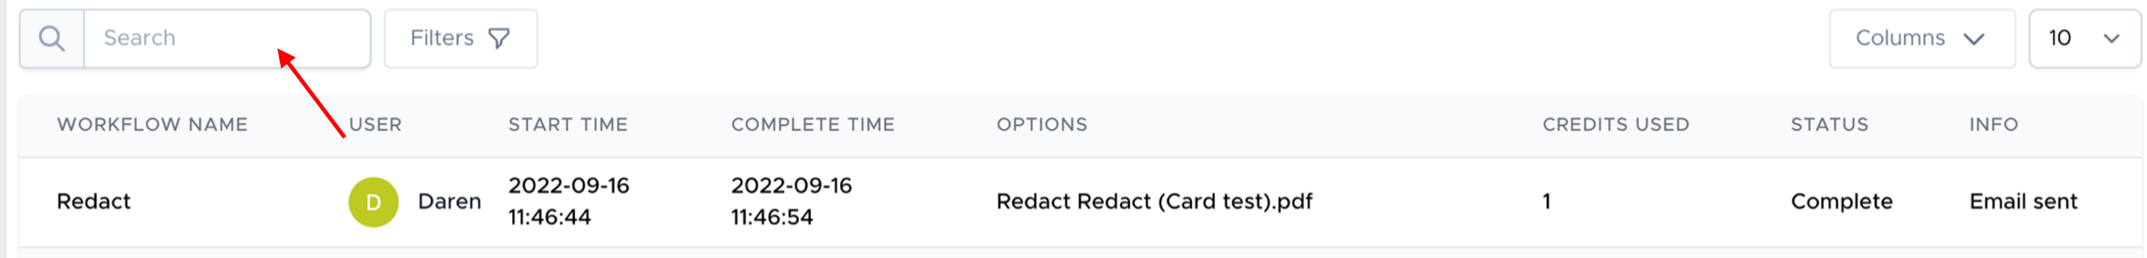
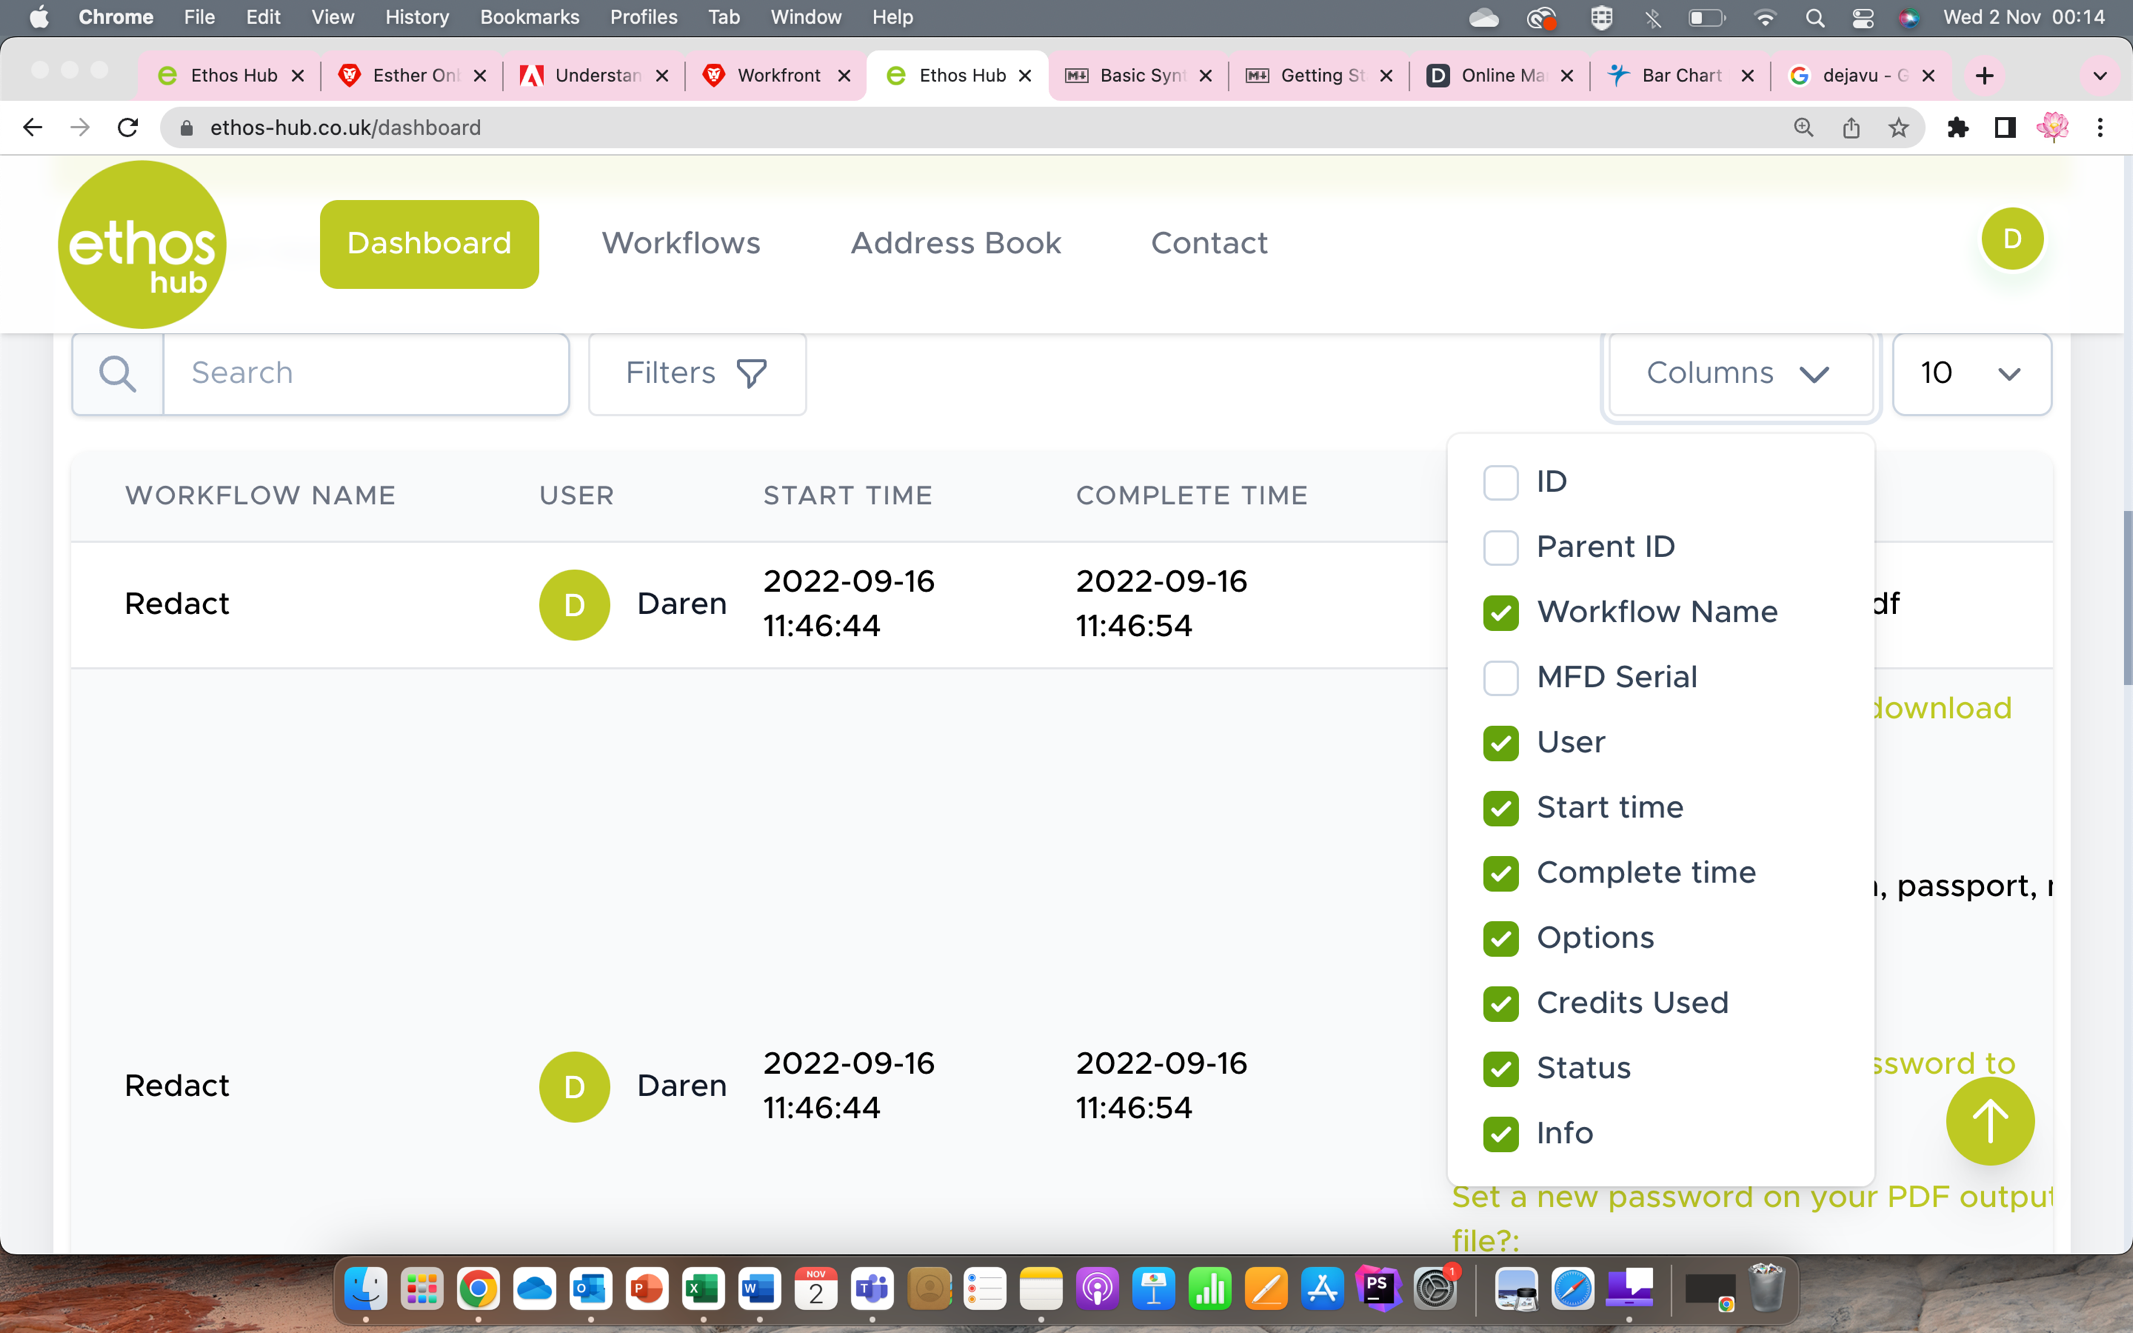
Search Bar
The search bar will allow you to search for specific information to filter the resulting logs and provides details regarding the workflow name, user, start time, complete time, options, credits used, status and information, this can be altered using the columns option.
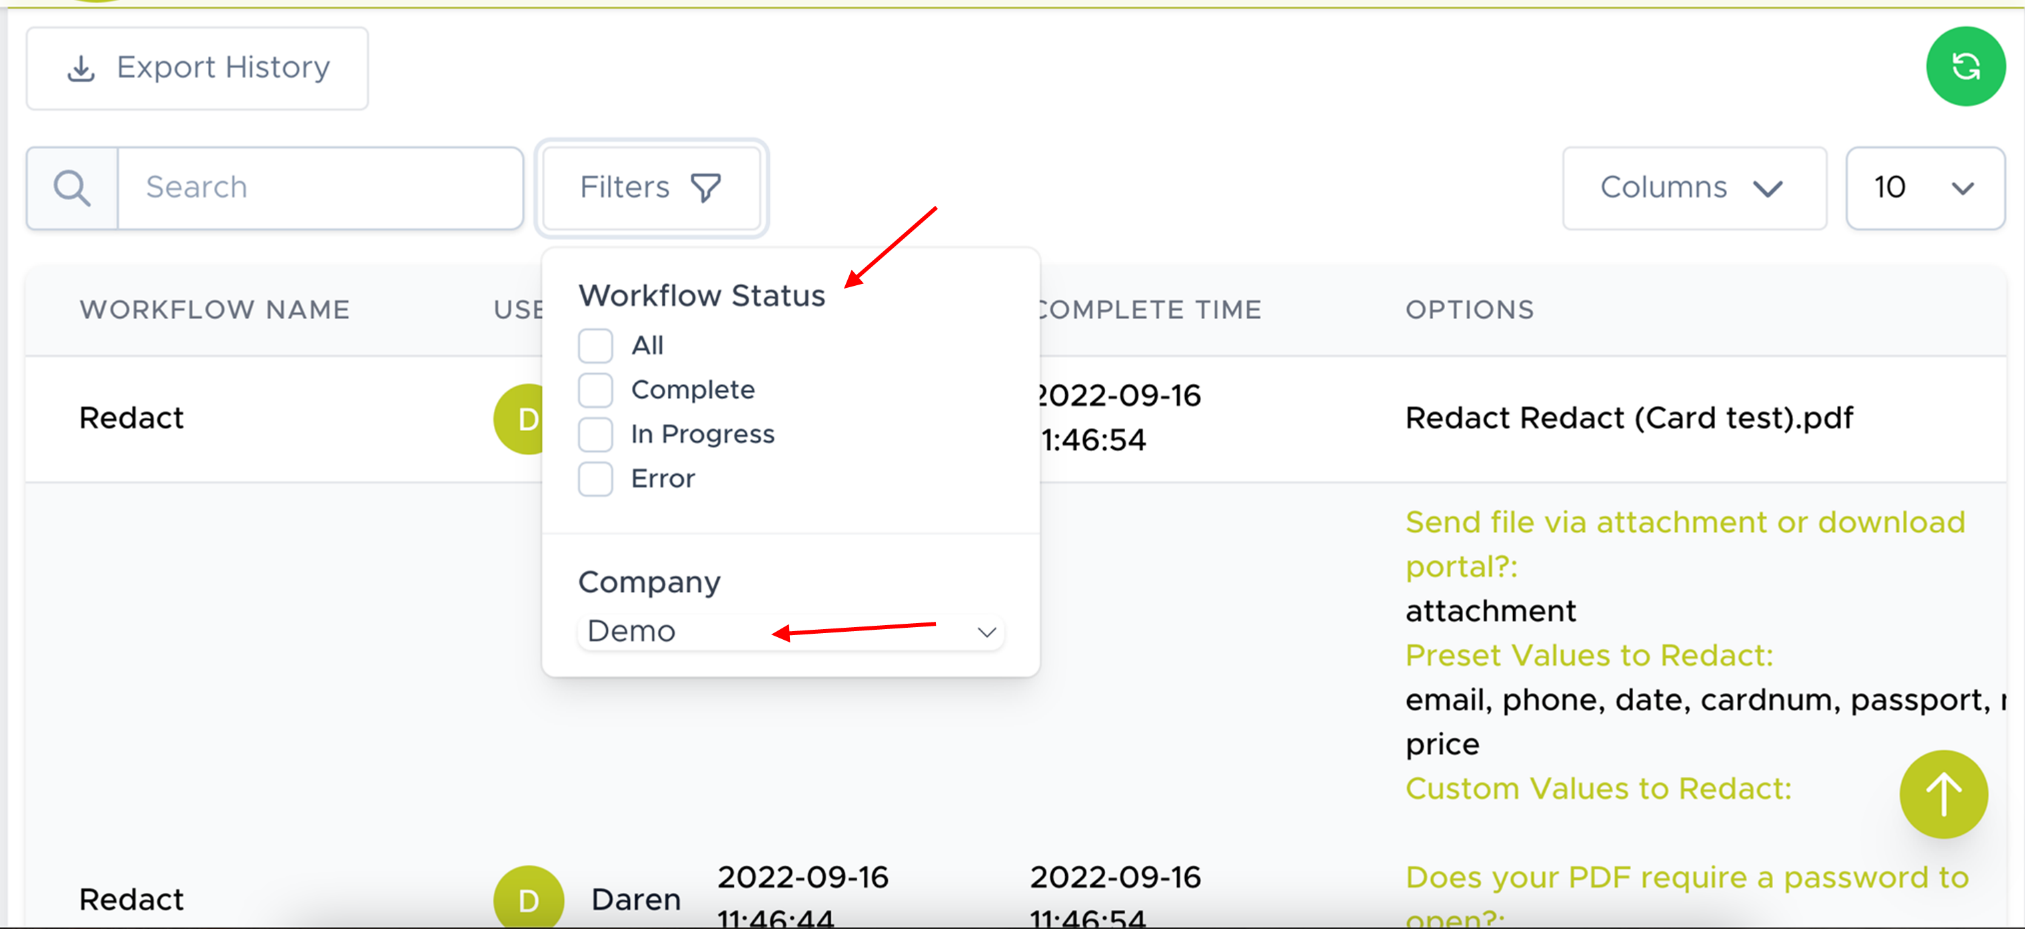
Filters
The filter option allows you to filter your search results based on the workflow status and the company.
Columns
The columns option allows you to choose what columns you would like to display in your workflow history.
Dashboard Information
On the right-hand side of your dashboard, you have various tiles depending on your permissions. Each of these tiles will be discussed further below.
User Count
 User count details information regarding the number of registered users in your company.
Admin Count
Admin count details information regarding the number of registered administrators in your company.
Workflow Count
Workflow count details information regarding the number of times your company has used the workflows.
Credits* Used
Credits* used details information regarding the number of credits your company has used.
Credits* Remaining
Credits* remaining details information regarding the number of credits your company has remaining.
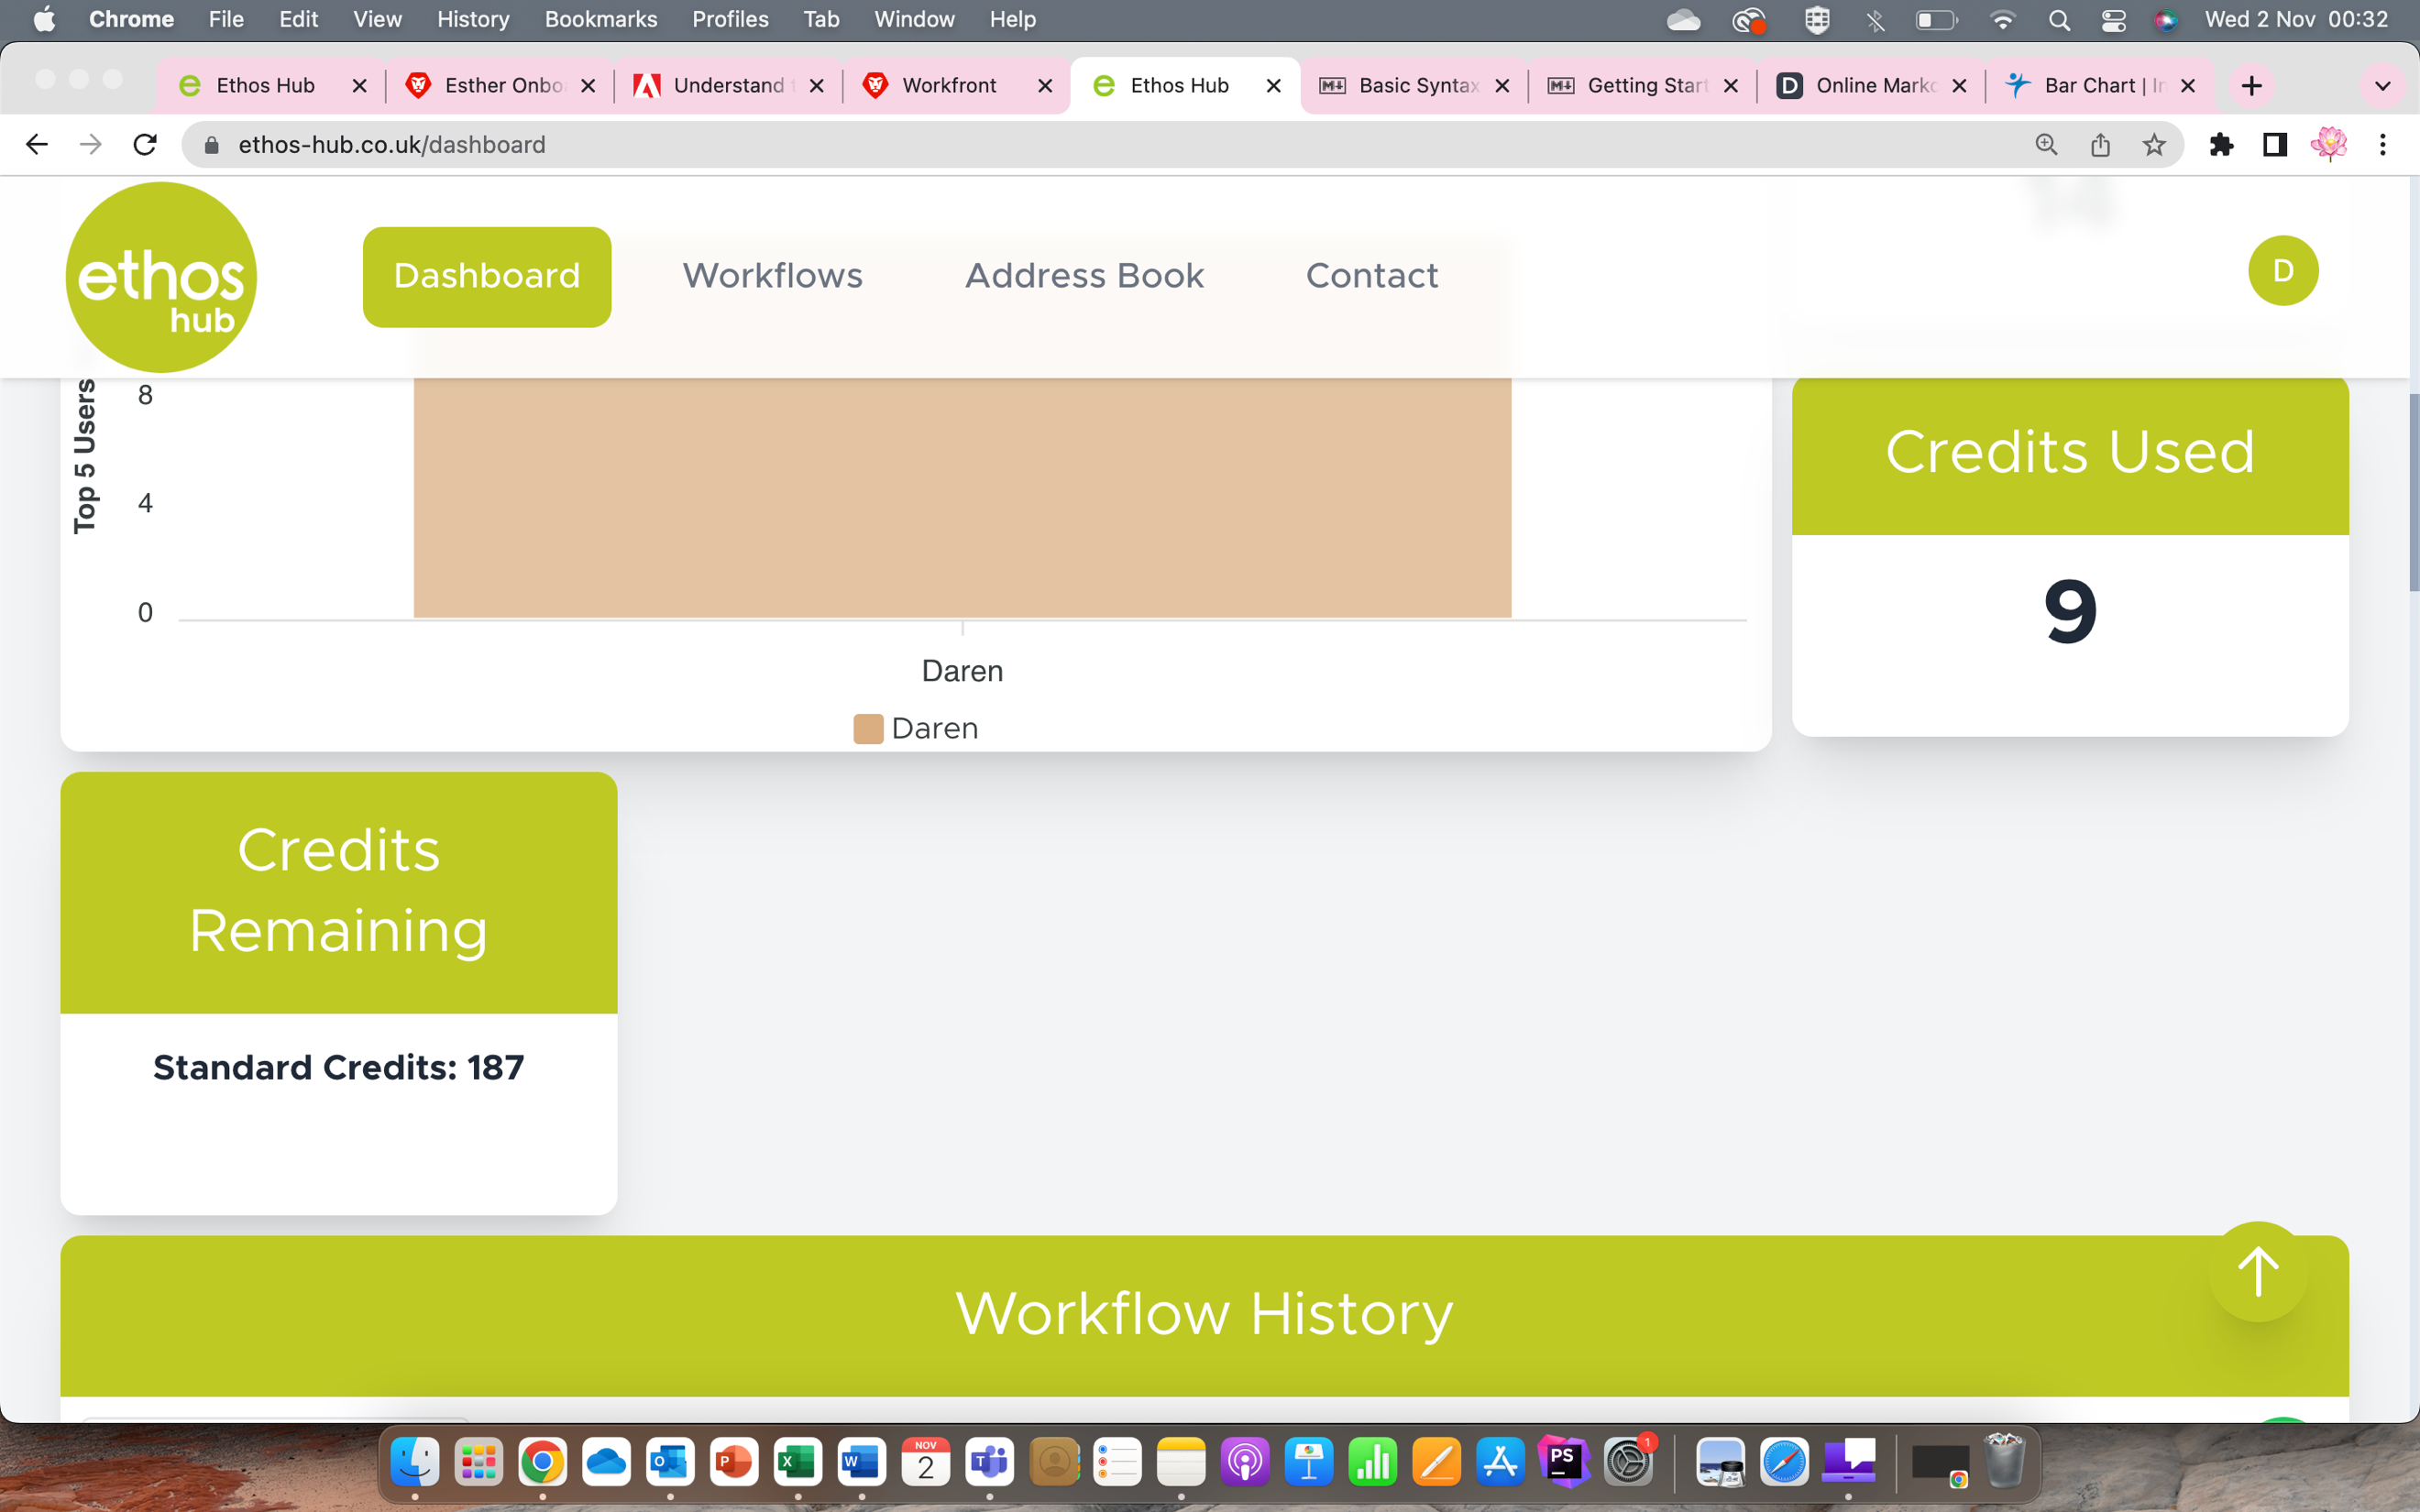
* Credits are equivalent to Standard Workflow Pages
Was this article helpful?
That’s Great!
Thank you for your feedback
Sorry! We couldn't be helpful
Thank you for your feedback
Feedback sent
We appreciate your effort and will try to fix the article